The Cylinder Overview presents "Trend View" and "Bar Graph" next to each other.
Cylinder Overview
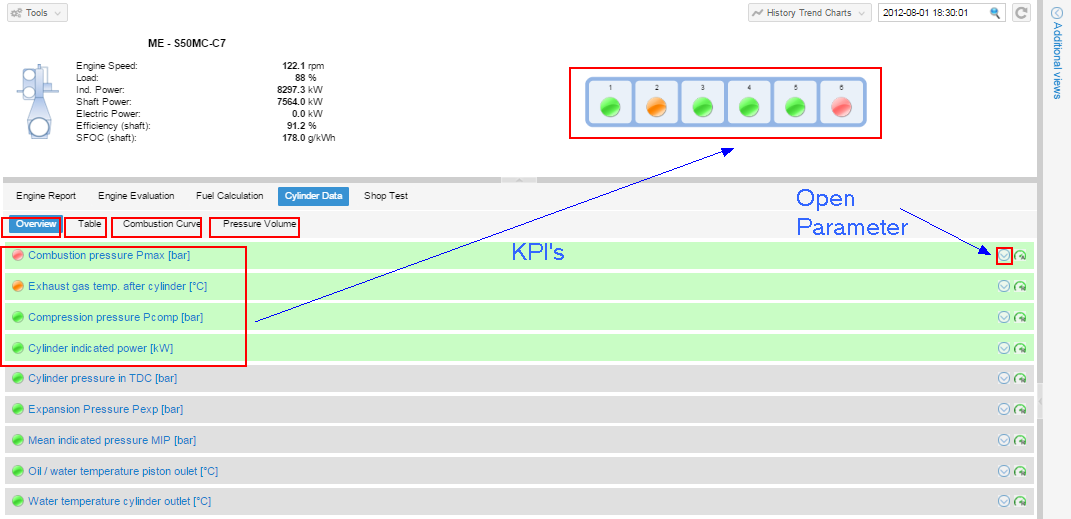
General remark: The overview of cylinder performance represents the actual status only form the selected KPI's in the "Engine Diagnostic Configurator"
In the parameter field the selected KPI's are presented in green. All other parameter are colored in grey.
1. Open parameter with the icon (see arrow on the right side)
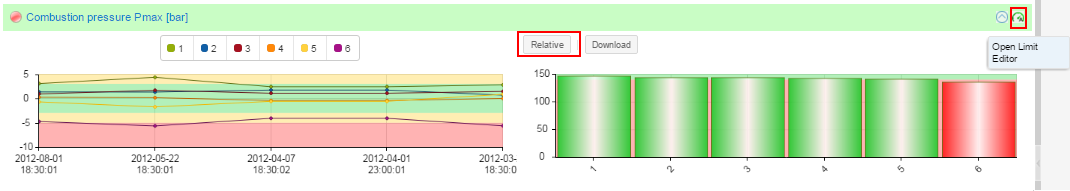
2. Parameter shows Trend Chart on "Relative Limits" and bar graph on "Absolute Limits".
(If "Absolute" button shows "Relative" to change)
3. Double click on "Open Limit Editor" (1)
4. The Limit Editor opens in the window of the browser on the right side showing the active "Parameter Settings" (2).
5. Change the default view "Absolute" to "Relative"
•Because "Relative" is not Active in the Limit editor the bar is colored grey.
•Please select "Relative" (3) in the limit editor and enter the limits.
•Please tick "Active" and press "Save" (4)
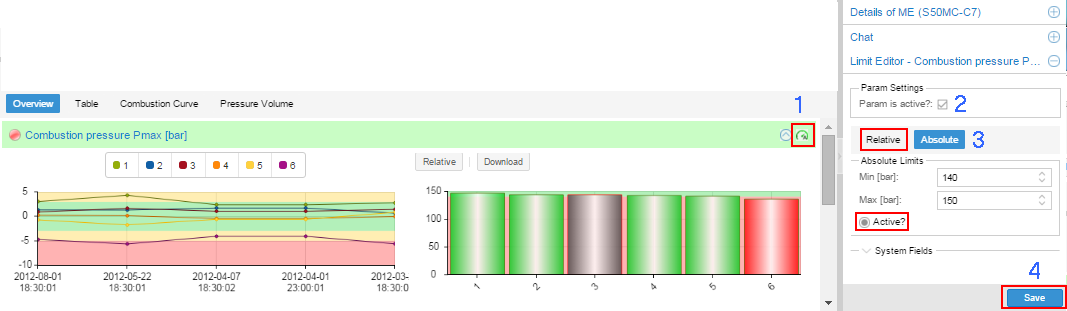
5. The screen will reload. Please reopen parameter view again and bar graph shows in "Relative Limits".
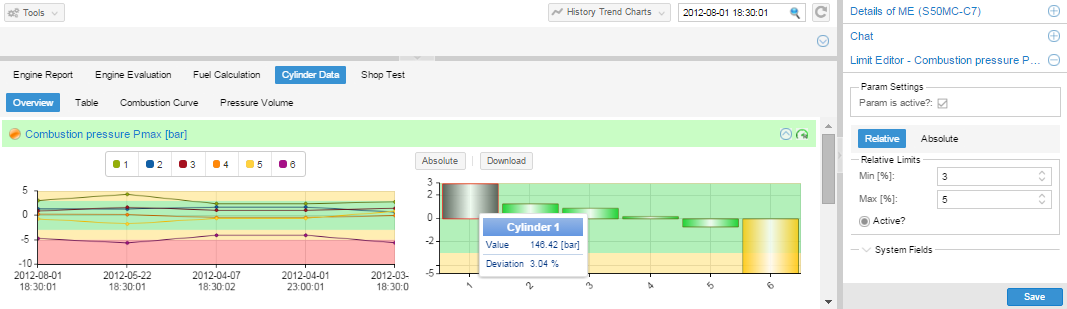
Cursor view:
With the cursor you can touch the graph and visualize the values.
Bargraph analyzing view
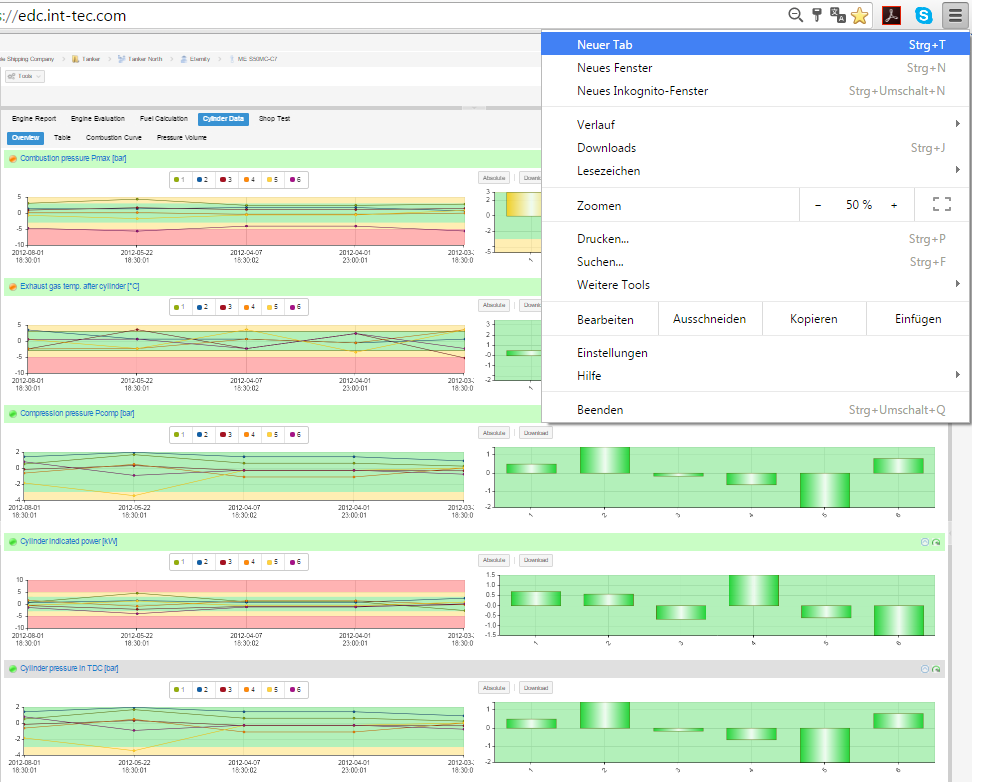
•If you like to analyze multiple bar graphs, please reduce the browser zoom as needed to show more parameters on the screen at the same time.
•Please reload the EDCenter view to fit the window.