The Fuel Calculation view is shared with the information of the Fuel Consumption History Trend view in the engine overview.
Fuel Calculation
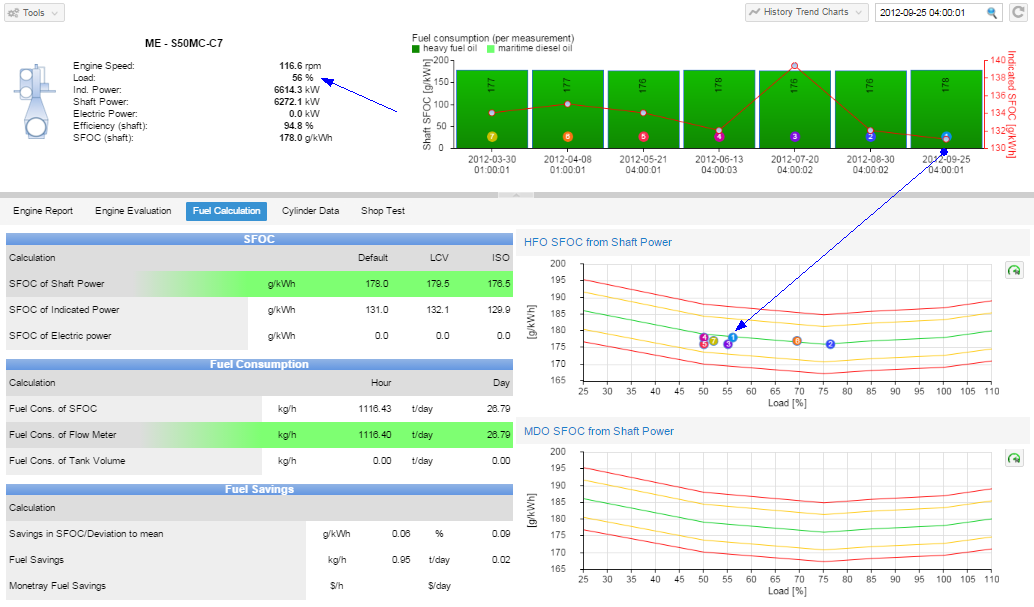
1. The left side of the fuel calculation view
•SFOC: Different SFOC calculations are available as Default / LCV / ISO corrected value. To see the results of all these calculations the Structure Configurator has to be set correctly and the reports have to be filled out with all necessary parameters for the fuel calculations!
- SFOC of Shaft Power
- SFOC of Indicated Power
- SFOC of Electric Power
•Fuel Consumption is calculated per hour in kg/h, and per day in t/day from different sources such as:
- Fuel Cons of SFOC
- Fuel Cons of Flow Meter
- Fuel Cons of Tank Volume
•Fuel Savings are presented in:
- in g/kWh
- in % (Deviation to mean indicated power)
- in kg/h
- t/day
- $/h
- $/day
The fuel saving calculation is based on the indicated power of the cylinders. The EDCenter is automatically calculating the deviation to mean which is based on power limits. There is a common understanding used by DNV: 1% difference in power means increase of 1% fuel consumption.
2. Fuel Calculation Graph
•HFO SFOC Shop test curve
The shop test curve presents Fuel Consumption measurements with numbers on the individual load and / SFOC position.
Example: See blue arrow measurement 1: SFOC 178g/kWh at 56% load on engine overview and shop test curve.
•MDO SFOC Shop test curve
If an MDO measurement would be available the presentation is similar to the HFO graph.