Fuel consumption on company level
In the example shows the actual fuel savings of all engines and the monthly history view of the past readings.
Fuel consumption
There are 3 possibilities to show the fuel savings
1. Fuel savings: in tons per day
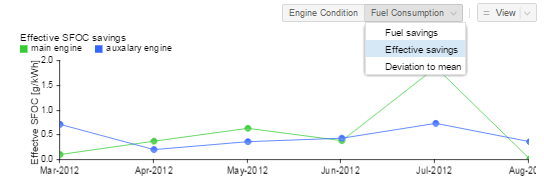
2. Effective savings: in SFOC gr/kWh
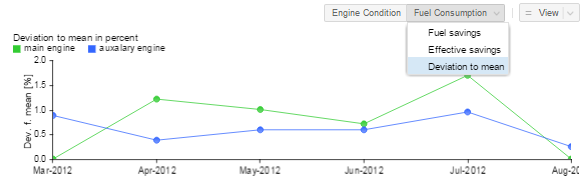
3. Deviation to mean: in (%)
1. Fuel consumption in group bar view
Please select "Fuel Consumption" and " Fuel savings". The graph presents the actual fuel savings of a company.
Preselected the fuel savings are presented in a group bar graph (2 bars).
a.Green: Summary of the main engine fuel savings
b.Blue: Summary of the auxiliary engine fuel savings
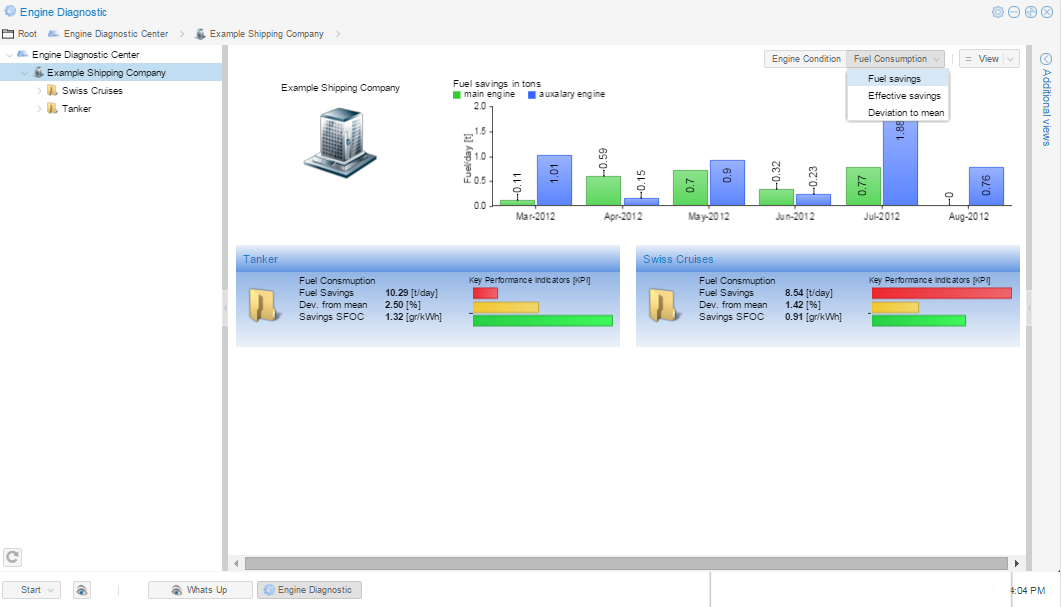
1. Cursor view
With the cursor you can touch the graph (color will change to white) an visualize the fuel savings.

2. Effective fuel savings line diagram
If you select the "Effective savings" the savings will be presented in a line diagram.
The calculation for the SFOC gr/kWh is based on an average value of all engines.
The two lines present the SFOC gr/kWh value of:
a.Green line: Main engines
b.Blue line: Auxiliary engines
3. Deviation to mean
If you select the "Deviation to mean" the cylinder power calculation in percent (%) of the deviation to mean is presented in a line diagram. The calculation is based on an average deviation to mean of all engines.
The two lines present the deviation to mean for
a. Green line: Main engines
b. Blue line: Auxiliary engines