Fuel consumption on engine level
In the example below you can see the actual fuel consumption as well as the fuel savings of your engines and the history trend view depending on the settings in the "Engine Diagnostic Configurator".
Fuel consumption
There are two possibilities to show the fuel savings:
1. Fuel savings*
The diagram shows:
• Fuel savings in tons per day as bar graph
• Deviation to mean of the cylinder power shown as line chart (red line)
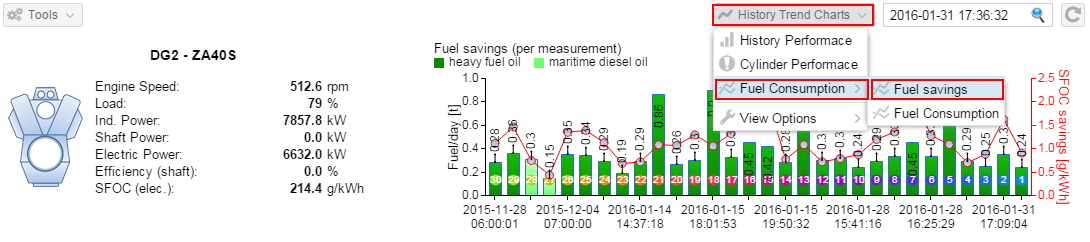
* The fuel saving calculation is based on the indicated power of the cylinder. The EDCenter is automatically calculating the deviation to mean which is based on power limits.
There is a common understanding used by DNV: 1% difference in power means increase 1% fuel consumption.
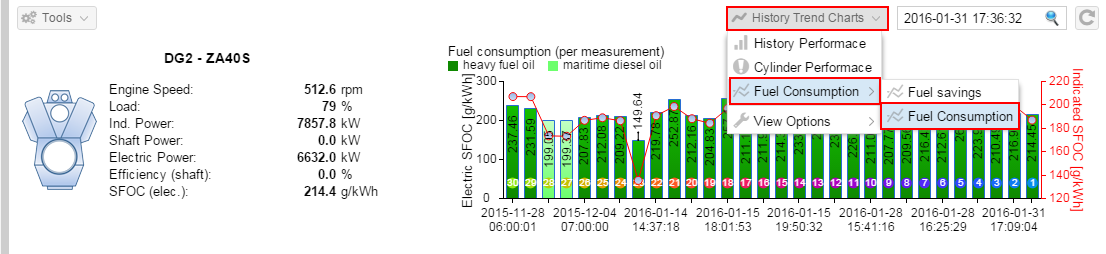
2. Fuel Consumption
General Remark:
The SFOC value is calculated from manual reports sent to the EDCenter or automatically evaluated by flow meters or from the automation system.
Different fuel qualities are marked with different colors (HFO dark green / MDF light green)
Depending on which power source is selected to calculate the Fuel Consumption the diagram shows two different views:
•SFOC of Shaft Power (as bar graph)
•SFOC of Electric Power (as bar graph)
•SFOC of Indicated Power (as red line)
Cursor view
With the cursor you can touch the graph and visualize the fuel consumption and savings information.